


KUP 21: Ability to operate and to interpret and analyse information obtained from radar and ARPA use

KUP 21: Ability to operate and to interpret and analyse information obtained from radar and ARPA use, including
1) range and bearing; course and speed of other ships; time and distance of closest approach of crossing, meeting overtaking ships,
2) identification of critical echoes; detecting course and speed changes of other ships; effect of changes in own ship’s course or speed or both,
3) application of the International Regulations for Preventing Collisions at Sea, 1972, as amended,
4) plotting techniques and relative- and true-motion concepts,
5) parallel indexing
Learning objective:
The learning objective is to develop the ability to operate radar and ARPA systems effectively and analyze the information obtained, including:
1. Calculating range, bearing, course, and speed of other ships, as well as determining time and distance for the closest approach of crossing, meeting, or overtaking vessels.
2. Identifying critical echoes, detecting course and speed changes in other vessels, and understanding the effects of changes in the ownship’s course and speed.
3. Applying the International Regulations for Preventing Collisions at Sea (COLREGs), 1972, as amended.
4. Using plotting techniques and understanding both relative- and true-motion concepts.
5. Implementing parallel indexing for safe and effective navigation.
Content
1. Introduction
Passage planning is essential for safe and efficient vessel navigation, involving the assessment of risks, environmental factors, and route selection. Mariners identify hazards such as shallow areas and obstructions, ensuring appropriate routes are chosen to minimize risks. They consider environmental factors like weather, tides, and currents, adjusting plans accordingly to navigate safely. Route planning focuses on optimizing safety and compliance with regulations, while navigational aids like charts and radar enhance decision-making. Contingency planning prepares mariners for emergencies, and continuous monitoring ensures real-time adaptation during the voyage. Effective passage planning promotes safety and reduces accidents at sea.
In this KUP, we focus on developing the skills necessary for the effective operation of radar and ARPA (Automatic Radar Plotting Aids) systems, critical tools for safe navigation. Learners will gain proficiency in analyzing radar data to calculate the range, bearing, course, and speed of other vessels, and determine the time and distance to their closest approach during crossing, meeting, or overtaking situations. The learning content will also cover techniques for identifying critical echoes, detecting course and speed changes in other ships, and understanding how adjustments to the ownship’s course and speed affect these calculations. Additionally, learners will apply the International Regulations for Preventing Collisions at Sea (COLREGs), 1972, in practical scenarios, while mastering plotting techniques and the concepts of relative and true motion. Finally, the content will introduce parallel indexing as a navigational tool to ensure safety and accuracy in vessel operations.
2. Determining range and bearing; course and speed of other ships; calculating time and distance of closest approach during crossing, meeting, or overtaking situations
Range
Usually, ranges are measured by means of the variable range marker (VRM). On some radars the VRM can be used to measure ranges up to only 20 miles although the maximum range scale setting is 40 miles. Fordistances greater than 20 miles, the fixed range rings must be used.
The radar indicators designed for merchant ship installation have range counter readings in miles and tenths of miles. According to the range calibration, the readings may be either statute or nautical miles. The range counter has three digits, the last or third digit indicating the range in tenths of a mile. As the VRM setting is adjusted, the range is read in steps of tenths of a mile. The VRM control may have coarse and fine settings. The coarse setting permits rapid changes in the range setting of the VRM. The fine setting permits the operator to make small adjustments of the VRM more readily. For accurate range measurements, the circle described by the VRM should be adjusted so that it just touches the inside edge of the pip [1].
Bearing
On most radar indicators bearings are measured by setting the mechanical bearing cursor to bisect the target pip and reading the bearing on the bearing dial.
With unstabilized Heading-Upward displays, true bearings are read on the outer, rotatable dial which is set either manually or automatically to ship’s true heading.
With stabilized North-Upward displays, true bearings are read on the fixed dial. With loss of compass input to the indicator, the bearings as read on the latter dial are relative. Some radar indicators designed for stabilized
North-Upward displays have rotatable relative bearing dials, the zero graduations of which can be set to the heading flash for reading relative bearings.
Some radar indicators, especially those having true motion displays, may have an electronic bearing cursor and associated bearing indicator. The electronic cursor is particularly useful when the display is off-centered [1].
Plotting terms and abbreviations
The application of simple geometry on a plotting sheet, a paper record of the radar display (PPI) over an interval of time, will enable you to determine the collision risk and safe action. The standard abbreviations drawn on a plotting sheet are:
C: The centre of a radar plotting sheet.
O: The position of an initial detection of a target on the PPI.
A: The position of a subsequent detection after a timed interval.
P: A point on extension of line OA passing closest & perpendicular to C.
CPA: The predicted closest point of approach of the paint.
TCPA: The predicted time of the closest point of approach.
Calculate the TCPA
(Length AP/Length OA) × time of O to A = time of A to P + time at A = TCPA
Calculate the distance
Distance = Speed X Time (Note: Ship’s speed is distance per 60 minutes)
EXAMPLE 1: DETERMINATION OF CLOSEST POINT OF APPROACH (CPA) [2]
Situation:
With own ship on course 070˚ and the radar set on the 12-mile range scale, other ship M is observed as follows:
| Time | Bearing | Range (miles) | Rel. position |
| 1000 | 050˚ | 9.0 | M1 |
| 1006 | 049˚ | 7.5 | M2 |
| 1012 | 047˚ | 6.0 | M3 |
Required:
(1) Direction of relative movement (DRM).
(2) Speed of relative movement (SRM).
(3) Bearing and range at closest point of approach (CPA).
(4) Estimated time of arrival at CPA.
Solution:
(1) Plot and label the relative positions, M1, M2, and M3, using the 1:1 scale; fair a line through the relative positions; extend this line, the relative movement line (RML), beyond the center of the Maneuvering Board.
(2) The direction of the RML from the initial plot M1, is the direction of relative movement (DRM): 236˚.
(3) Measure the relative distance (MRM) between any two timed plots on the RML, preferably between the two best plots with the greatest time
separation. In this instance, measure the distance between M1 and M3: 3.0 miles. Using the corresponding time interval (1000 – 1012 = 12m),
obtain the speed of relative movement (SRM) from the Logarithmic Time-Speed-Distance Scale at the bottom of the Maneuvering Board: 15
knots.
(4) From the center of the radar plotting sheet, R, draw a line perpendicular to the RML; label the intersection CPA. The direction of the
CPA from the center of the plotting sheet, i.e., own ship’s position, is the bearing of the CPA: 326˚; the distance from the center or own ship is the range at CPA: 0.9 mile.
(5) Measure the distance from M3 to CPA: 6.0 miles. Using this distance and the speed of relative movement (SRM): 15 knots, obtain the time
interval from 1012 (the time of plot M3) by means of the Time-SpeedDistance Scale: 24m. The estimated time of arrival at CPA is 1012 + 24m =
1036.
Answers:
(1) DRM 236˚; (2) SRM 15 knots; (3) CPA 326˚, 0.9 mile; (4) ETA at CPA 1036.
EXAMPLE 2: COURSE AND SPEED OF A RADAR CONTACT [2]
Situation:
Own ship R is on course 340˚, speed 15 knots. The radar is set on the 12-mile range scale. A radar contact, ship M, is observed to be changing course, and possibly speed, between times 0953 and 1000. While keeping a close watch of the relative movement, the relative positions of M are marked at frequent intervals on the reflection plotter by grease pencil.
Required:
(1) Course and speed of ship M when M has steadied on course and speed.
Solution:
(1) With the decision made that the solution will be obtained by rapid radar plotting, the solution is started while M is still maneuvering through
determining: (a) the distance own ship will travel through the water during a time lapse of 6 minutes and (b) the length of such distance on the PPI at the range setting in use.
(i) The distance traveled by own ship in 6 minutes is one-tenth of the speed in knots, or 1.5 nautical miles.
(ii) The length of 1.5 nautical miles on the PPI may be found through use of the variable range marker (VRM). Crank the VRM out to a convenient starting point, 6 miles for instance.
Mark the intersection of the VRM and the heading flash. Crank the VRM out to 7.5 miles and mark the intersection of the VRM and the heading flash. The length between the two marks (1.5 mi.) is transferred to a short plastic rule.
(2) Observation of the PPI reveals that between 1000 and 1006, M is on a steady course at constant speed (successive plots form a straight line on the scope; plots for equal time intervals are equally spaced). Draw the relative movement line (RML) from the 1000 plot (M1) through the 1006 plot (M3), extending beyond the center of the PPI.
(3) Set center line of parallel-line cursor to heading flash. At the 1000 plot (M1) place the plastic rule, marked for the 6-minute run of own ship, parallel to the cursor lines. In the direction of own ship’s course, draw a line of 1.5 miles length which ends at the 1000 plot. Two sides of the vector triangle have been formed (er and rm). The solution is obtained by completing the triangle to form true (course-speed) vector em.
(4) On completing the triangle, the third side, vector em, represents the true course and rate of movement of M. The true course may be read by adjusting the parallel-line cursor parallel to the third side, true vector em. The speed of M in knots may be estimated by comparing the length of em with the length of er, the true (course-speed) vector of own ship R, the speed of which in knots is known.
Answers:
(1) Course 252˚, speed 25 knots.
3. Identification of critical echoes
An echo sounder is the instrument used to determine the depth of water beneath the keel. In order to do this it transmits pulses of sound which bounce off the sea bed.

The echo sounder system comprises four components, namely a transmitter, a receiver, a transducer and a display unit. The transmitter creates a short pulse of AC current which it passes to the transducer which is situated at the bottom of the ship. The transducer converts this pulse into sound (like a loudspeaker) which it transmits towards the sea bed. When it reaches the sea bed, this pulse is reflected back to the transducer which now acts like a microphone and converts it back into an electrical current. This is then passed to the receiver where it is amplified and converted into a useable format and displayed on the display unit. In the receiver, there is also a very accurate timing device which measures the time taken between transmission of the pulse and reception of the echo. Since the speed of sound in water is known (approx 150 metres per second) the receiver can now calculate the depth of water between the transducer and the sea bed and this is what is displayed to the operator [3].
4. True course and speed of contact
To determine the true course and speed of a contact by graphical solution on the reflection plotter, follow the procedure given below [7].
(1) As soon as possible after a contact appears on the PPI, plot its relative position on the reflection plotter. Label the position with the time of the observation as shown in figure 4.1. When there is no doubt with respect to the hour of the plot, it is only necessary to show the last two digits, i.e., the minutes after the hour. In those instances where an unduly long wait would not be required it might be advantageous to delay starting the timed plot until the time is some tenth of an hour…, 6 minutes, 12 minutes, 18 minutes, etc., after the hour. This timing could simplify the use of the 6-minute plotting interval normally used with the rapid radar plotting technique.
(2) Examine the relative plot to determine whether the contact is on a steady course at constant speed. If so, the relative positions plot in a straight or nearly straight line; the relative positions are equally (3) With the contact on a steady course at constant speed, select a suitable relative position as the origin of the relative speed (DRM-SRM) vector; label this plot r as shown in figure4.2.
(4) Crank the parallel-line cursor until its lines are parallel to the heading flash. As shown in figure 4.2, place the appropriate plastic rule so that one notch is at r and its straightedge is parallel to the lines of the
cursor and the heading flash. The rule is scaled for a 6-minute run between notches.
(5) Select the time interval for the solution, 12 minutes for example. Accordingly, the origin e of own ship’s true (course-speed) vector er is at the second notch from r; m, the head of the contact’s true ( course-speed)
vector, is at the plot 12 minutes beyond r in the direction of relative movement.
(6) Construct the contact’s true (course-speed) vector em.
(7) Crank the parallel-line cursor so that its lines are parallel to vector em as shown in figure 4.3. The contact’s true course is read on the true bearing dial using the radial line of the parallel-line cursor; the
contact’s true speed is estimated by visual comparison with own ship’s true vector er. For example if em is about two-thirds the length of er, the contact’s speed is about two-thirds own ship’s speed. Or, the
notched rule can be used to determine the speed corresponding to the length of em.
5. Application of the International Regulations for Preventing Collisions at Sea, 1972, as amended
International Regulations for Preventing Collision at Sea Rule 5 (Lookout) “Every vessel shall at all times maintain a proper look-out by sight as well as by hearing as well as by all available means appropriate in the prevailing circumstances and conditions so as to make a full appraisal of the situation and of the risk of collision”.
The rules require a vessel fitted with radar to make use of its detection capability for a full appraise by monitoring and radar plotting, especially in restricted visibility.
The International Regulations for the Prevention of Collisions at Sea (1972) as amended (Colregs) requires the systematic observations of targets. Extracts from Rule 7 b. and c. state [6]:
- Rule 7b. “Proper use shall be made of radar equipment if fitted and operational, including long range scanning to obtain early warning of risk of collision and radar plotting or equivalent systematic observation of detected targets”.
- Rule 7c. “Assumptions shall not be made on the basis of scanty information especially scanty radar information”.
The relative motion (relative velocity) plot (relvel) gives the deck officer an understanding of the combined movement of vessels when under way and making way. The relative motion plot takes the following factors into account – when given any four factors, the remaining two can be calculated [3]:
The combined speed of both vessels.
The true course of the observing (own) vessel.
The actual speed of the observing (own) vessel.
The true course of another ship (the target observed).
The actual speed of another vessel (the target observed).
The combined movement of both vessels.
International Regulations for Preventing Collision at Sea specify radar usage:
Rules 6 (Safe Speed extract), “every vessel shall at all times proceed at a safe speed so that she can take proper and effective action to avoid collision.”
Rule 7 (Risk of Collision extract) warns that “assumptions shall not be made on the basis of…scanty radar information”
Rule 19 (Restricted Visibility extract) requires that “a vessel which detects by radar alone the presence of another vessel shall determine if a close-quarters situation is developing and/or risk of collision exists…she shall take avoiding action in ample time” [3].
6. Using plotting techniques and understanding relative and true motion concepts
Until recently, transfer plotting techniques or the transfer of radar plot information to a separate polar plotting diagram were given primary emphasis in the training of radar observers. Studies of the increasing numbers of collisions among radar-equipped ships have directed attention to the fact that too many mariners, usually trained only in transfer plotting
techniques, were not making effective use of their radars because of a number of factors, including [7]:
(1) Their performance of multiple duties aboard merchant ships with little if any assistance.
(2) The problems inherent to transfer plotting, such as the time lag in measuring the ranges and bearings and transferring this data to a separate plot, and the possibility of error in transferring the data.
(3) Their attention being directed away from the radar indicator and the subsequent movements of the targets and the appearance of new targets on the PPI while recording, plotting, and constructing graphical solutions on a
separate plotting diagram.
(4) In a multiple radar contact situation, the confusion and greater probability for blunders associated with the construction of overlapping vector triangles, the vectors of which must be related to separate relative
plots.
(5) The general lack of capability of competent radar observers to determine expeditiously initial relative motion solutions for more than about two or three radar contacts imposing possible danger at one time while using conventional transfer plotting techniques. The latter capability generally requires the use of at least two competent radar observers. Evasive action by one or more of the radar contacts may result in an extremely confusing situation, the timely solution of which may not be practicable by means of transfer plotting techniques.
Summary of Vector Components.
WA Other vessel’s true course and distance covered over the same time period as OA.
OA Relative movement of vessels which includes relative direction and the relative movement over the period between the first and last plots.
WO Own vessel’s true course and the distance covered over the same time period as OA.
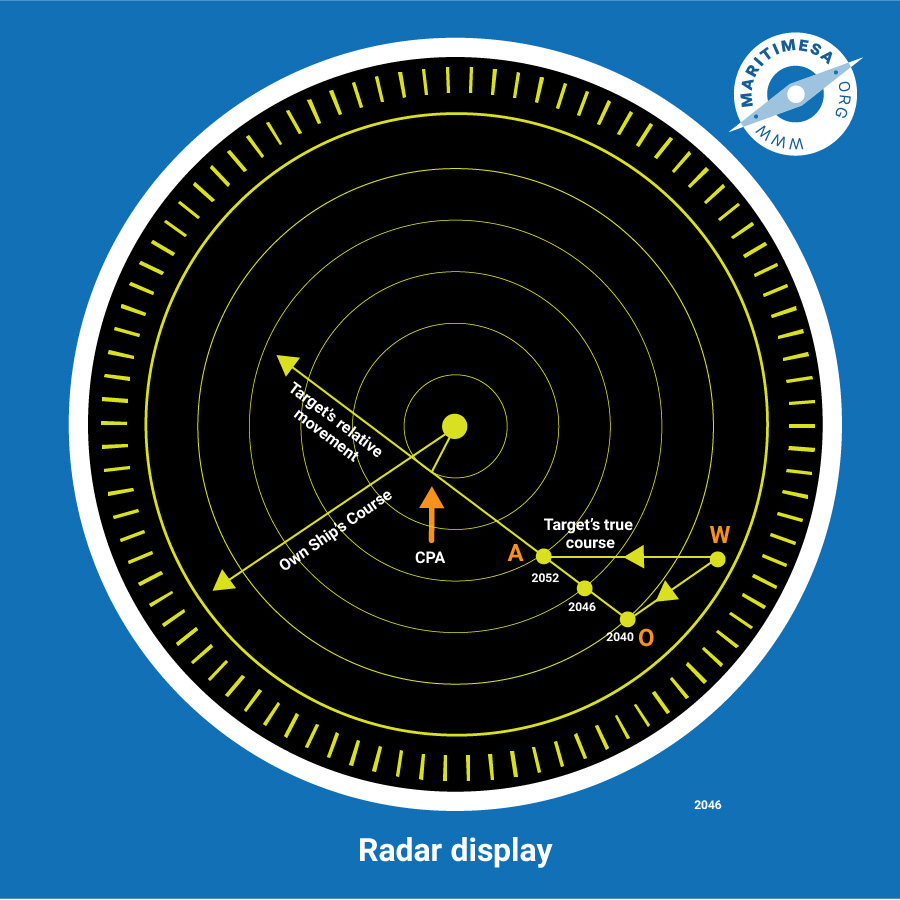
Plotting procedure.
The relative velocity problem is solved by the use of vectors on a plotting diagram as follows:
Measure the length of “W-A” which is the distance travelled by the other ship in 12 minutes. From this calculate the other ship’s true speed (distance of “W-A” multiplied by five).
Lay off the observing (own) ship’s true course.
Plot the first bearing and distance of the target observed and next to it insert the time
and the letter “O”.
Plot the second bearing and distance and insert the time next to it (six minutes later).
Plot the third bearing and distance and next to it insert the time and the letter “A” (a
further six minutes later).
Join “O” and “A” and extend this line past the centre of the plot. This is the projected
movement of the target and this extension will indicate whether a risk of collision will result. Insert an arrow in the direction of movement.
Insert the observing (own) ship’s course in reverse from point “O”. The length of this vector is the distance travelled by own ship at it’s present speed for 12 minutes. Mark the end of this vector with the letter “W”. Insert an arrow in the direction of own ship’s course.
Complete the triangle by joining “W” to “A”. Insert an arrow in the direction of “A”.
Determine the direction of “W-A” which is the other ship’s true course.
7. Employing parallel indexing techniques
Parallel indexing is a technique used as a measure to monitor the progress of a vessel on the track to minimise the cross-track distance, and to keep the vessel at a safe distance from the shoreline or rock.
The basic principle of this method is that to maintain and follow a particular course – a bearing line drawn parallel to the original course with a known and fixed perpendicular distance between both lines is used as a reference.
The increase or decrease of the perpendicular distance between the bearing lines drawn parallel to course-line and the ship’s position at any time will indicate cross-track deviation from the initial planned course and thus advise a mariner if he/she is falling out of a traffic lane, entering a traffic separation zone or closing into a navigational danger.
The reference point from which the bearing line parallel to the course line is drawn is taken as a fixed buoy, lighthouse, headland, jetty, fixed platform or fixed radar conspicuous object. Thus, the imaginary line drawn parallel to the course to steer from a fixed object is always at a fixed distance from it.
While a ship follows a course to steer, parallel indexing ensures it always remains at a fixed distance from a hazard. Thus, parallel indexing is a method to alert a mariner that he has come close to a navigational hazard.
Parallel indexing technique can be used as it is provided in the options menu of marine radar where distance between parallel lines can be fixed and it can also be set to maintain safe distance from two fixed objects simultaneously on either side of a vessel [5].
8. Identifying misrepresentation, false echoes, sea return, racons, and SARTs
By adjusting radar settings and understanding patterns, operators can effectively identify and minimize misrepresentation and clutter on the radar screen:
SARTs: Search and Rescue Transponders (SARTs) are used during distress situations. When triggered, they create a series of equally spaced dots on the radar screen, typically forming an arc or a line extending toward the SART’s location. This pattern is unique and easily distinguishable from regular echoes.
False Echoes: These appear as ghost images caused by reflections off structures, high land, or multiple reflections from the ship’s superstructure. They usually appear at a constant distance and bearing relative to the true target. Adjusting the radar’s gain or using anti-clutter controls can help identify and reduce false echoes.
Sea Return: This is clutter caused by radar waves reflecting off the sea surface, often appearing as dense, random clutter near the ship, especially in rough seas. Using the Sea control feature (clutter suppression) helps reduce this effect, allowing real targets to be distinguished.
Racons: Racons (radar beacons) are intentionally placed on navigation aids and emit a distinct radar signal when “triggered” by a ship’s radar. They appear as a line of dots or a specific pattern radiating from the location of the beacon. Identifying these patterns helps distinguish racons from normal echoes.
Recommendation
References
- National Geospatial-Intelligence Agency. “CHAPTER 2 — RADAR OPERATION”. – Radar Navigation and Maneuvering Board Manual“. Maritime Safety Information. https://ccga-pacific.org/files/library/Ch._2-Radar_Operations.pdf
- National Geospatial-Intelligence Agency. “CHAPTER 3 — COLLISION AVOIDANCE – Radar Navigation and Maneuvering Board Manual“. Maritime Safety Information. https://msi.nga.mil/Publications/RNMB
- Ranger Hope © 2008. “RADAR PLOTTING”. https://www.splashmaritime.com.au/Marops/data/text/Radartex/Radarplottex.htm
- Captain Godfrey Schlemmer. “Echo sounder”.https://maritimesa.org/nautical-science-grade-12/2020/09/20/echo-sounder/
- Chief Officer Abhishek Bhanawat January 20, 2024, Marine Navigation. “How To Use Parallel Indexing Techniques For Ship Navigation?” https://www.marineinsight.com/marine-navigation/parallel-indexing-techniques-for-ship-navigation/
- Captain Godfrey Schlemmer. “Radar plotting”. https://maritimesa.org/nautical-science-grade-12/2020/09/17/radar-plotting/
- National Geospatial-Intelligence Agency. “CHAPTER 3 — COLLISION AVOIDANCE – Radar Navigation and Maneuvering Board Manual“. Maritime Safety Information.